Chapter 13 Comparative Multi-Question Plots
This chapter teaches you how to create a single graph that summarizes responses for multiple variables for many countries.
These types of graphs are especially useful for plotting grid questions. Grid questions use the same stem, but have different endings. Technically, while related, they are all unique questions. Therefore, plotting a set of grid questions on the same graph, is the same thing as plotting multiple question on one graph.
All questions are required to be the same type when using this function. Comparing the responses to different question types is not advised, so the function does not allow for it.
At the end, your code will look like the following:
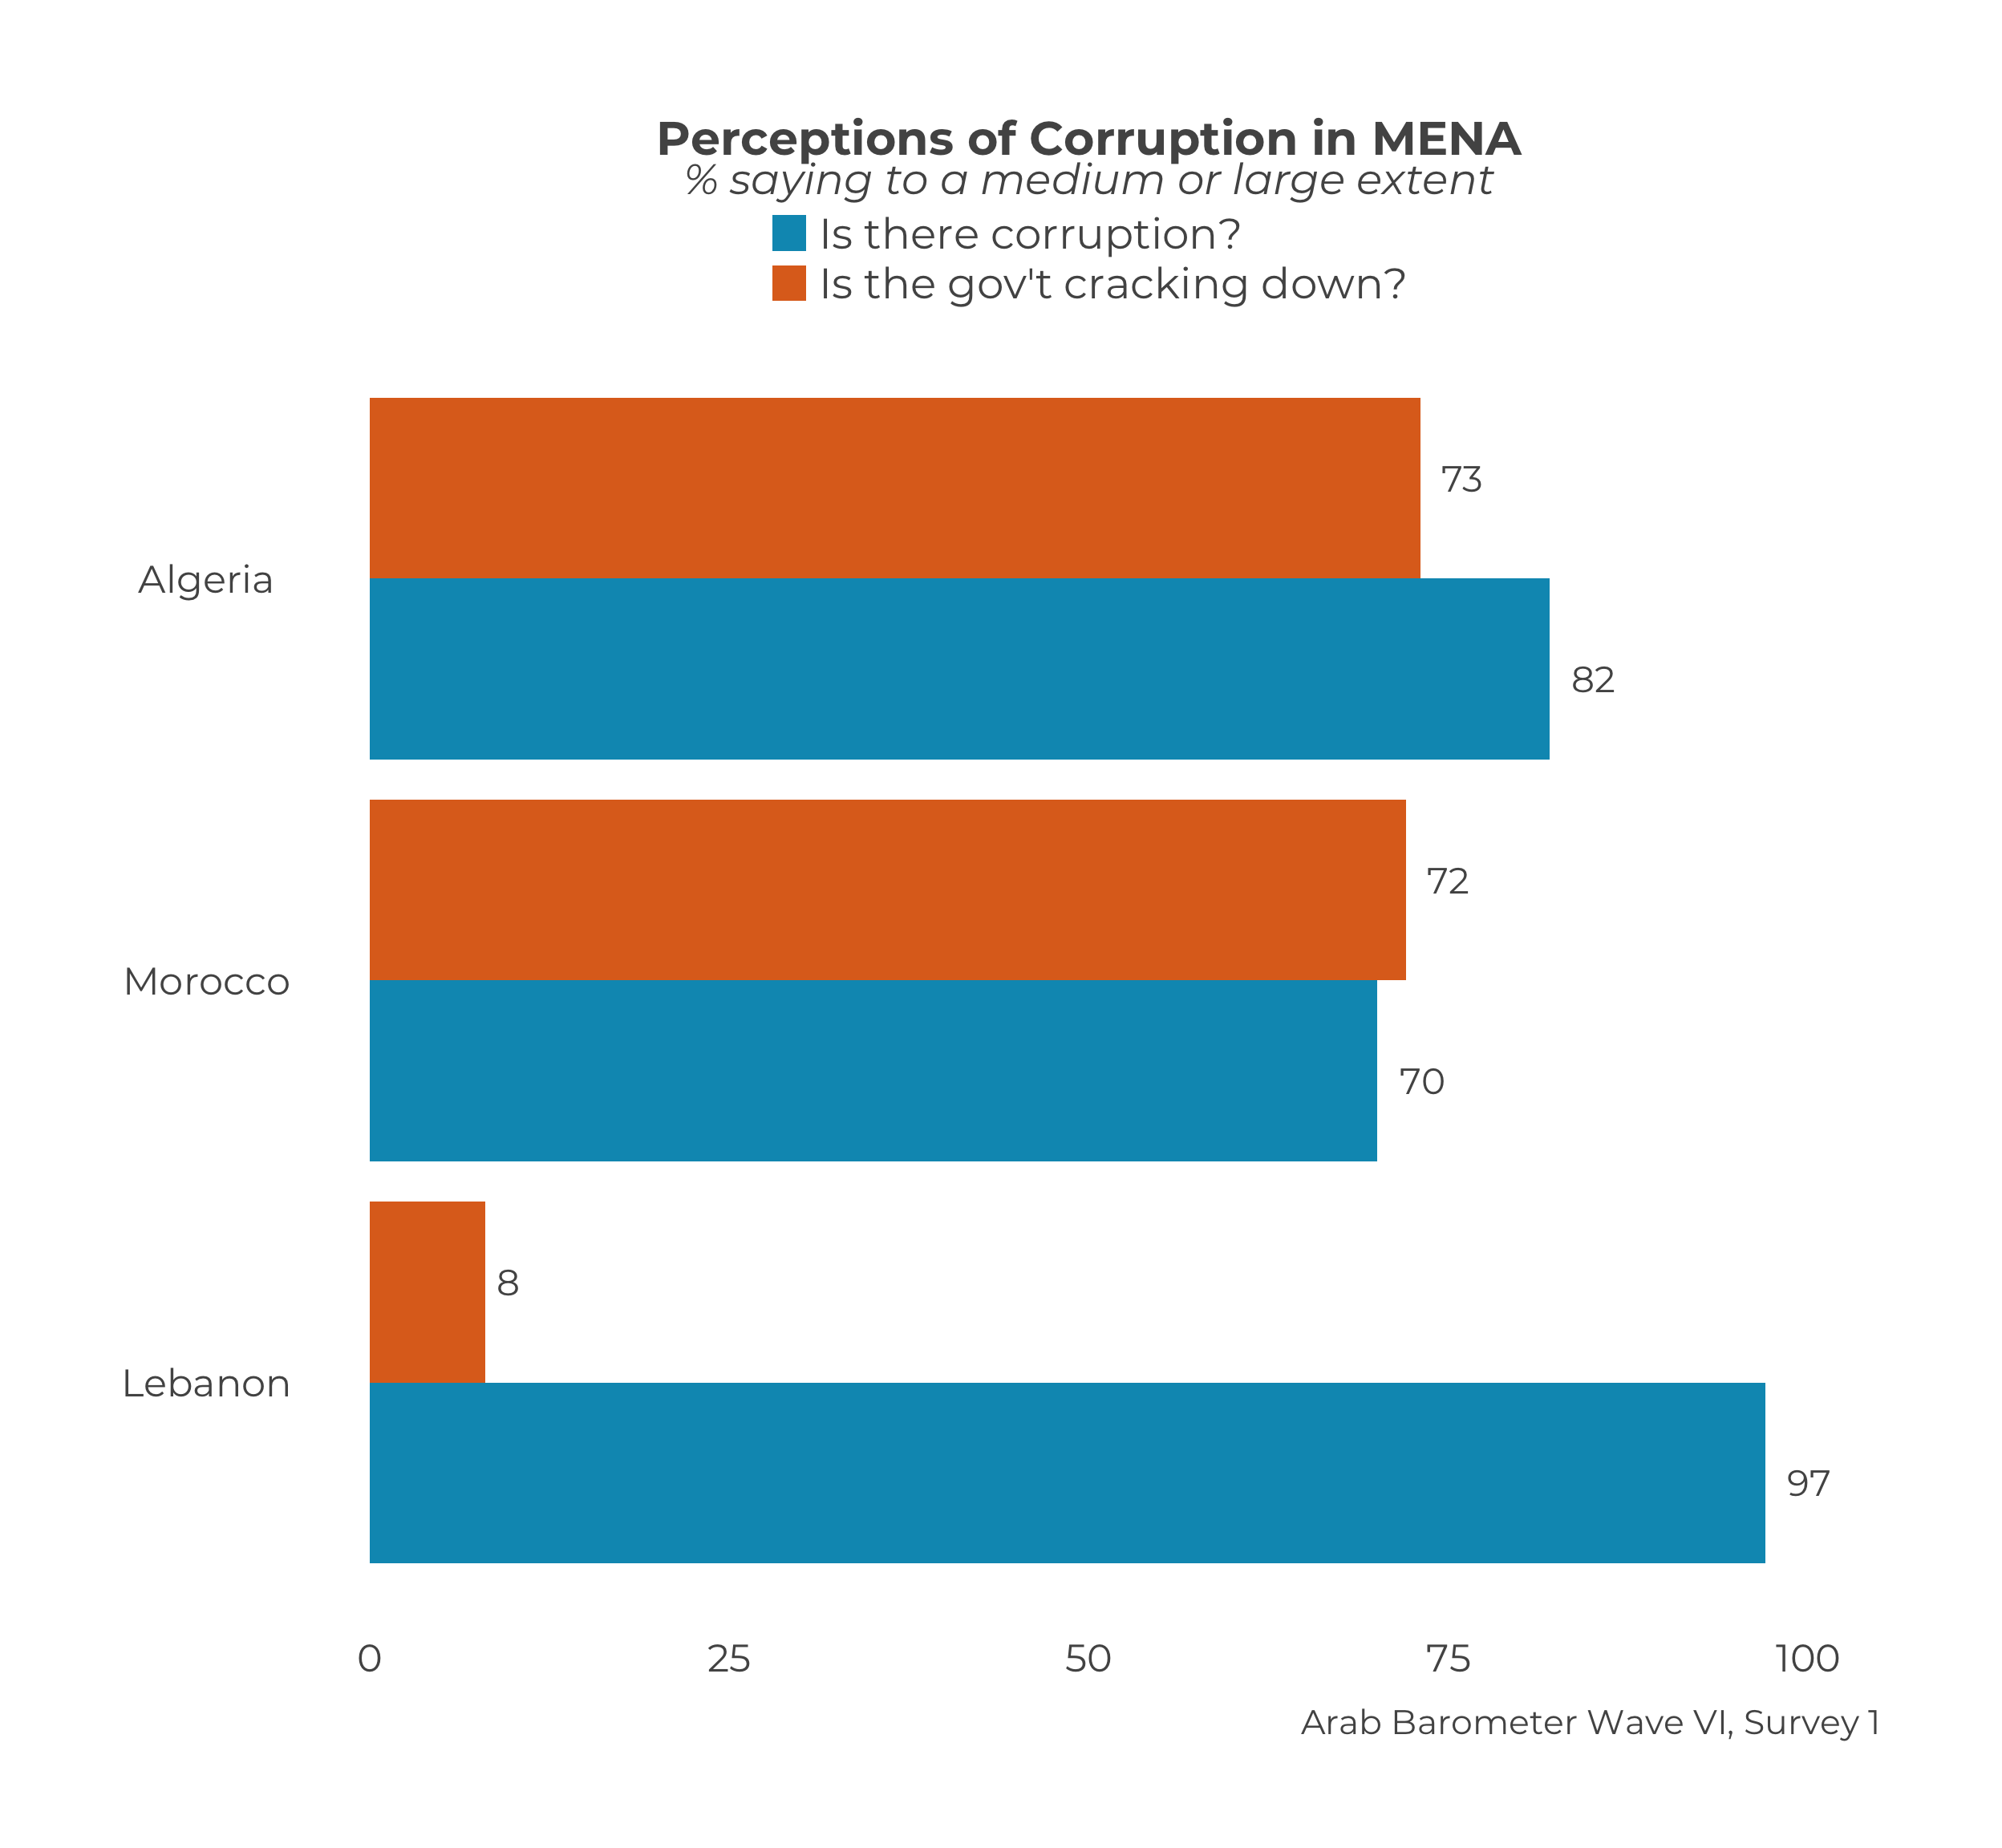
questions_2_compare <- list("Q210",
                            "Q211")

question_labels <- c("Is there corruption?",
                      "Is the gov't cracking down?")

plot_multiquestions_comp(survey1,
                        questions_2_compare,
                        question_labels,
                        .title = "Perceptions of Corruption in MENA",
                        .subtitle = "% saying to a medium or large extent",
                        .caption = "Arab Barometer Wave VI, Survey 1")
That code will produce the following graph:
Let’s go!
13.1 Prep Work
The prep work for creating a multiquestion graph for many countries is exactly the same as the prep work suggested for creating a multiquesiton graph for a single country.
13.1.1 Question List
First create a list of questions you want to include on your graph. For the example in this chapter we are comparing questions Q210 and Q211. We put the names of those variables in a list and save that list as an object.
Now the variables we want to graph as saved to the object questions_2_compare in a list.
13.1.2 Question Labels
The next step is to create a vector of labels for the questions. This is the text that will display on the y-axis. The labels should appear in the same order as they variables they are referring to.
question_labels <- c(
  "Is there corruption?",       # Text for Q210
  "Is the gov't cracking down?" # Text for Q211
  )
The object question_labels represents the text that will serve to label the responses on the graph.
13.2 Plot a Comparative Multiquestion Graph
We are now ready to create our graph. The function plot_multiquestions_comp() is used to create a graph for one country that displays responses to multiple questions. There are three required arguments. They are: .ab, .questions, and .question_labels.
The parameter .ab is the for Arab Barometer data frame.
The .questions parameter requires a list (or vector) of questions. This is how the function knows which questions to include on the graph. We created a list, questions_2_compare, in the section above.
The .question_labels parameter requires a vector (or list) of question labels. The labels must appear in the same order as the questions to appear on the graph correctly. We created a vector, questions_labels, in the section above.
Time to fill in our function. The data we are using for the example is survey1.
plot_multiquestions_comp(
  .ab = survey1,
  .questions = questions_2_compare,
  .question_labels = question_labels
)
## Warning in title_function(.var = "multiquestion graphs", .title = .title, : There is currently no title for `multiquestion graphs`.
## ℹ Please specify your own until this has been corrected.## Warning in subtitle_function(.var = "multiquestion graphs", .subtitle = .subtitle, : There is currently no subtitle for `multiquestion graphs`.
## ℹ Please specify your own until this has been corrected.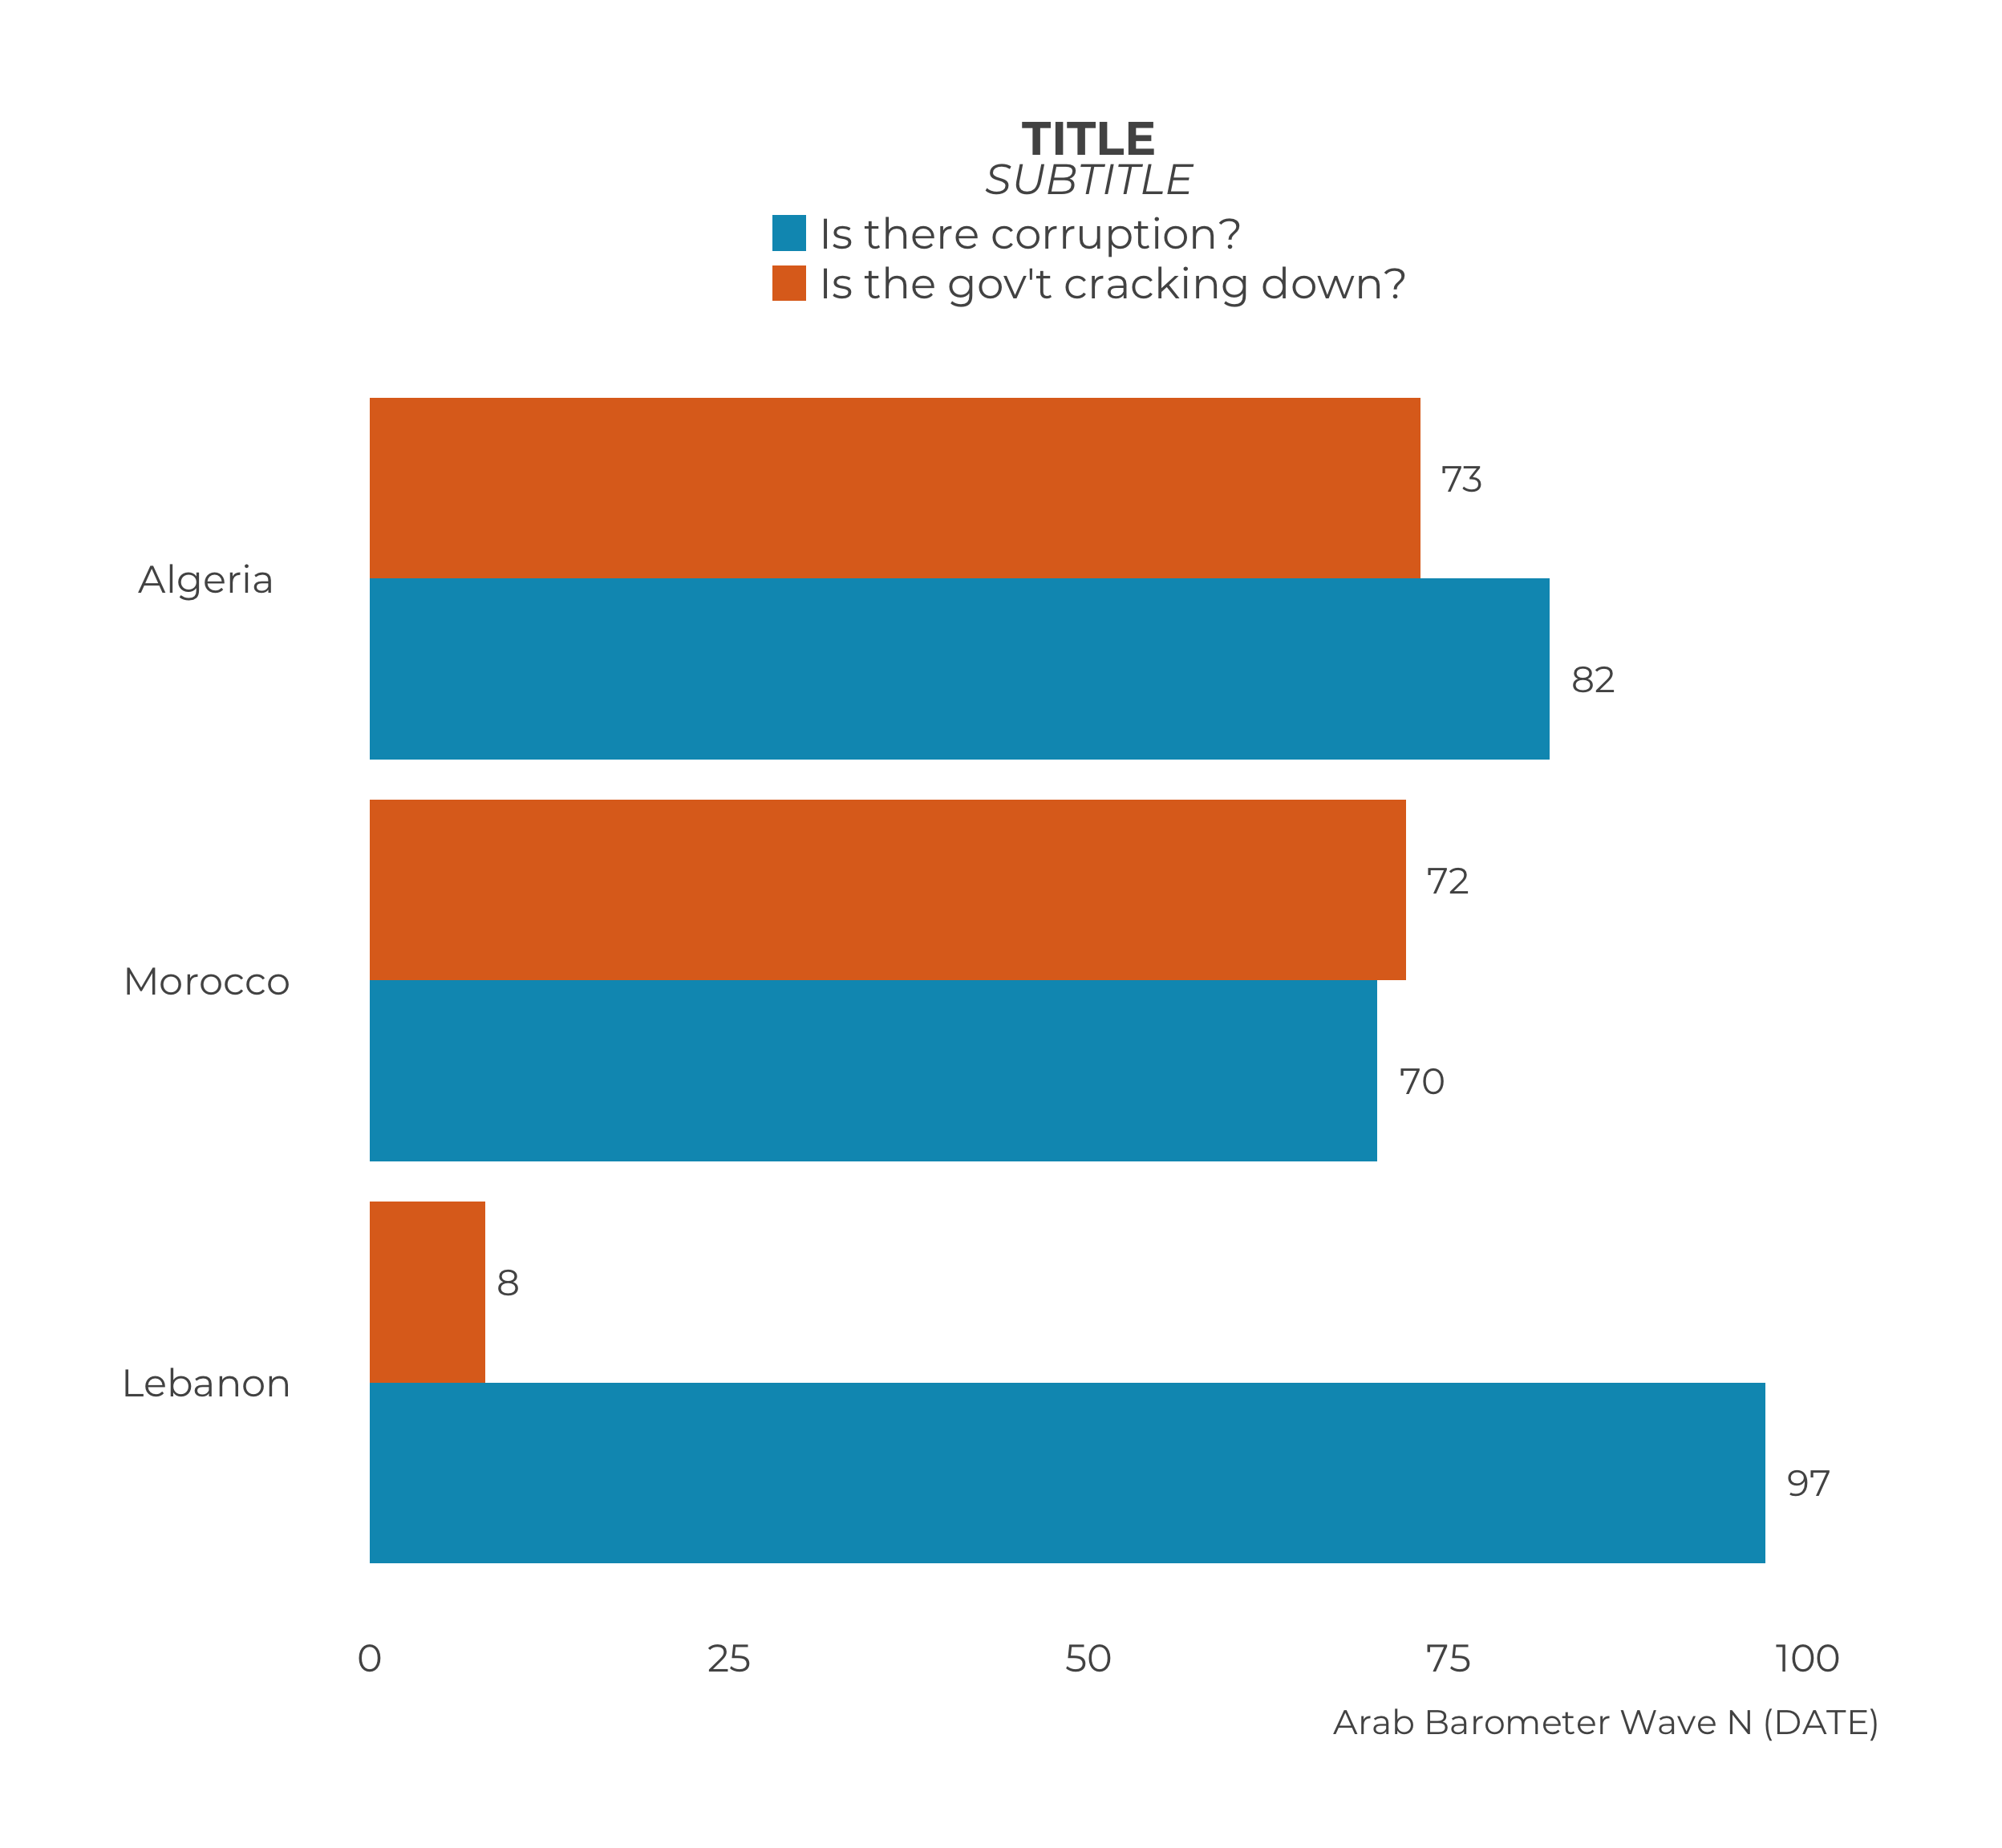
Notice there are several missing elements in this graph. Namely, an appropriate title, subtitle, and caption. These three aspects are not included in the list of required arguments, because a graph can be created without them. If you want to use the graph publicly, however, it would be prudent to include them.
The parameters for including a title, subtitle, and caption are the same as they are in any other function: .title, .subtitle, and .caption, respectively. We can fill these in to create our final graph.
plot_multiquestions_comp(
  .ab = survey1,
  .questions = questions_2_compare,
  .question_labels = question_labels,
  .title = "Perceptions of Corruption in MENA",
  .subtitle = "% saying to a medium or large extent",
  .caption = "Arab Barometer Wave VI, Survey 1"
)
13.3 Extras
13.3.1 Setting Colors
By default, the colors for the graph are randomly selected from ArabBarometer_clr. To set the colors of the graph, supply a vector of hex codes or named Arab Barometer brand colors to the parameter .clr_choice.
13.3.2 Data Frame
There is no calculate_ function that accompanies this function. All calculations are done internally. The parameter .return_df allows the user to see the data frame used to create the graph. Setting .return_df to TRUE will cause the function to return a list containing the graph and the data frame. Setting .return_df to "only" will cause the function to only return the data frame.
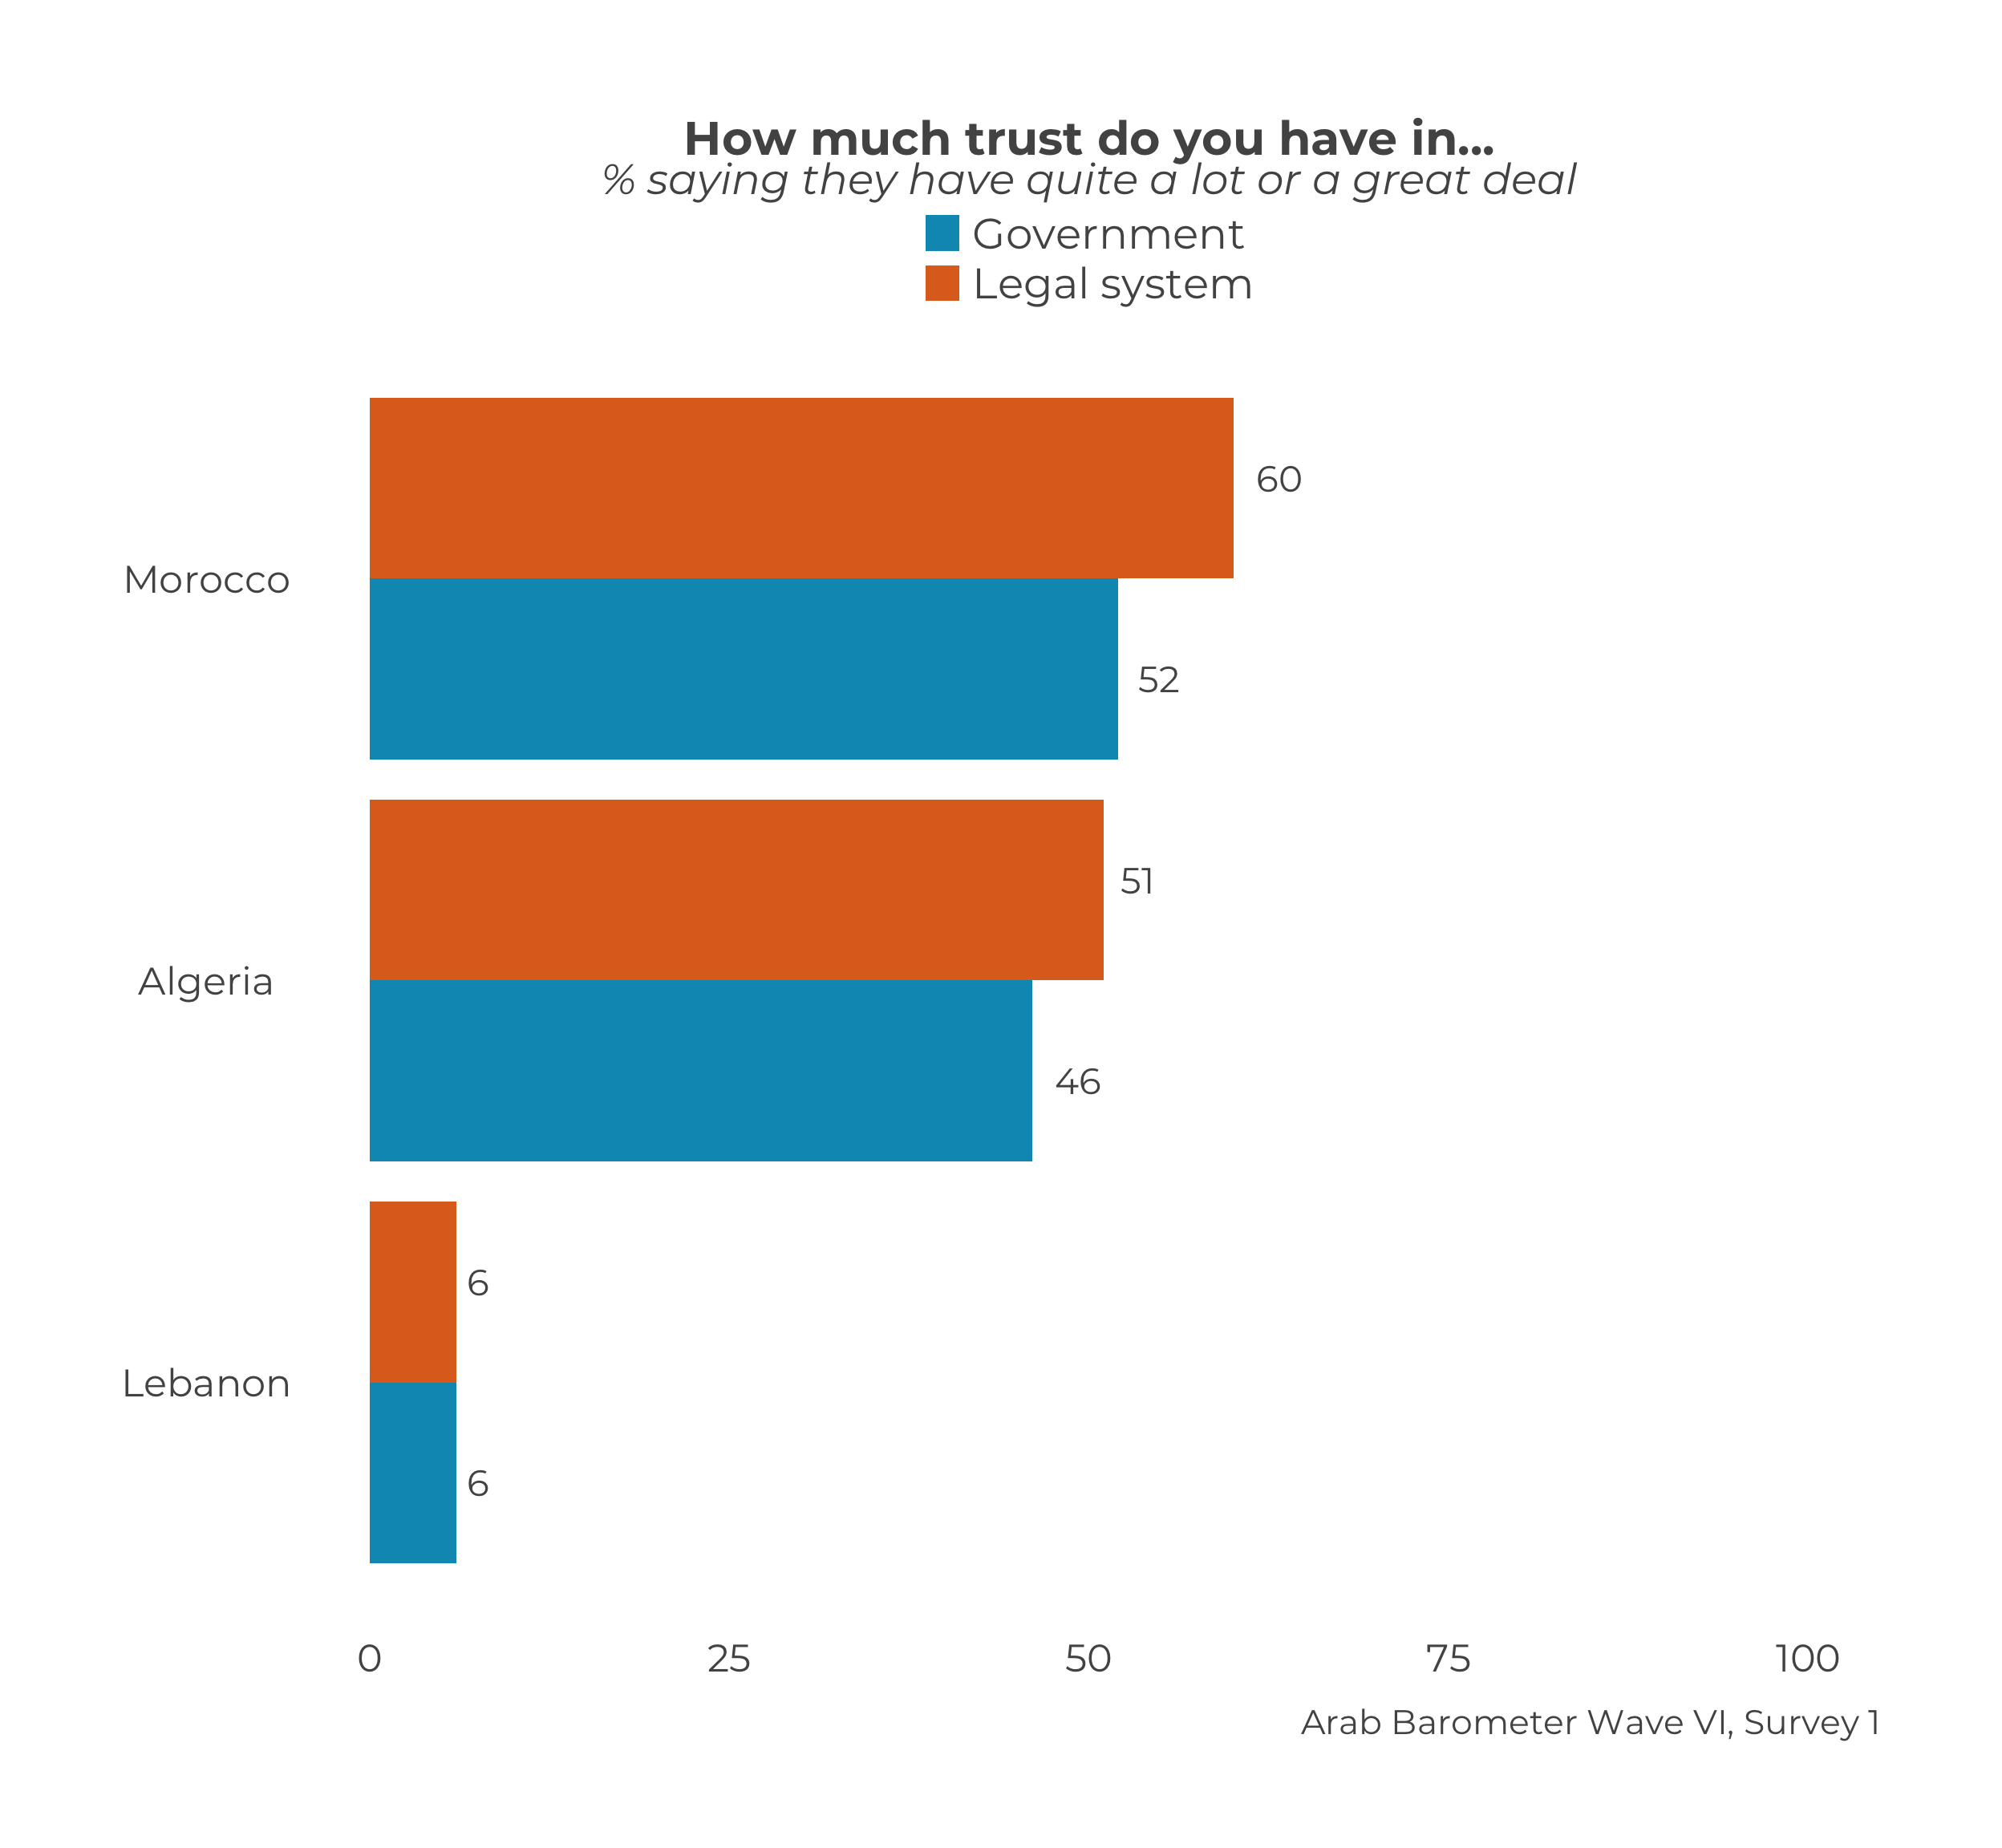
13.3.3 Explict Grid Example
Remember: plotting a set of grid questions requires exactly the same steps as outlined throughout this chapter. There is no difference between plotting 2 (or n) questions that belong to a grid, and 2 (or n) questions that do not.
# Identifying two question from a grid set:
questions_2_compare <- list(
  "Q201A_1",
  "Q201A_2"
)

# Supplying labels:
question_labels <- c(
  "Government",
  "Legal system"
)

# Plotting the grid questions:
plot_multiquestions_comp(
  .ab = survey1,
  .questions = questions_2_compare,
  .question_labels = question_labels,
  .title = "How much trust do you have in...",
  .subtitle = "% saying they have quite a lot or a great deal",
  .caption = "Arab Barometer Wave VI, Survey 1"
)