Chapter 14 BARE BONES: Single Country Multi-Question Trend Plots
At the end, your code will look like the following:
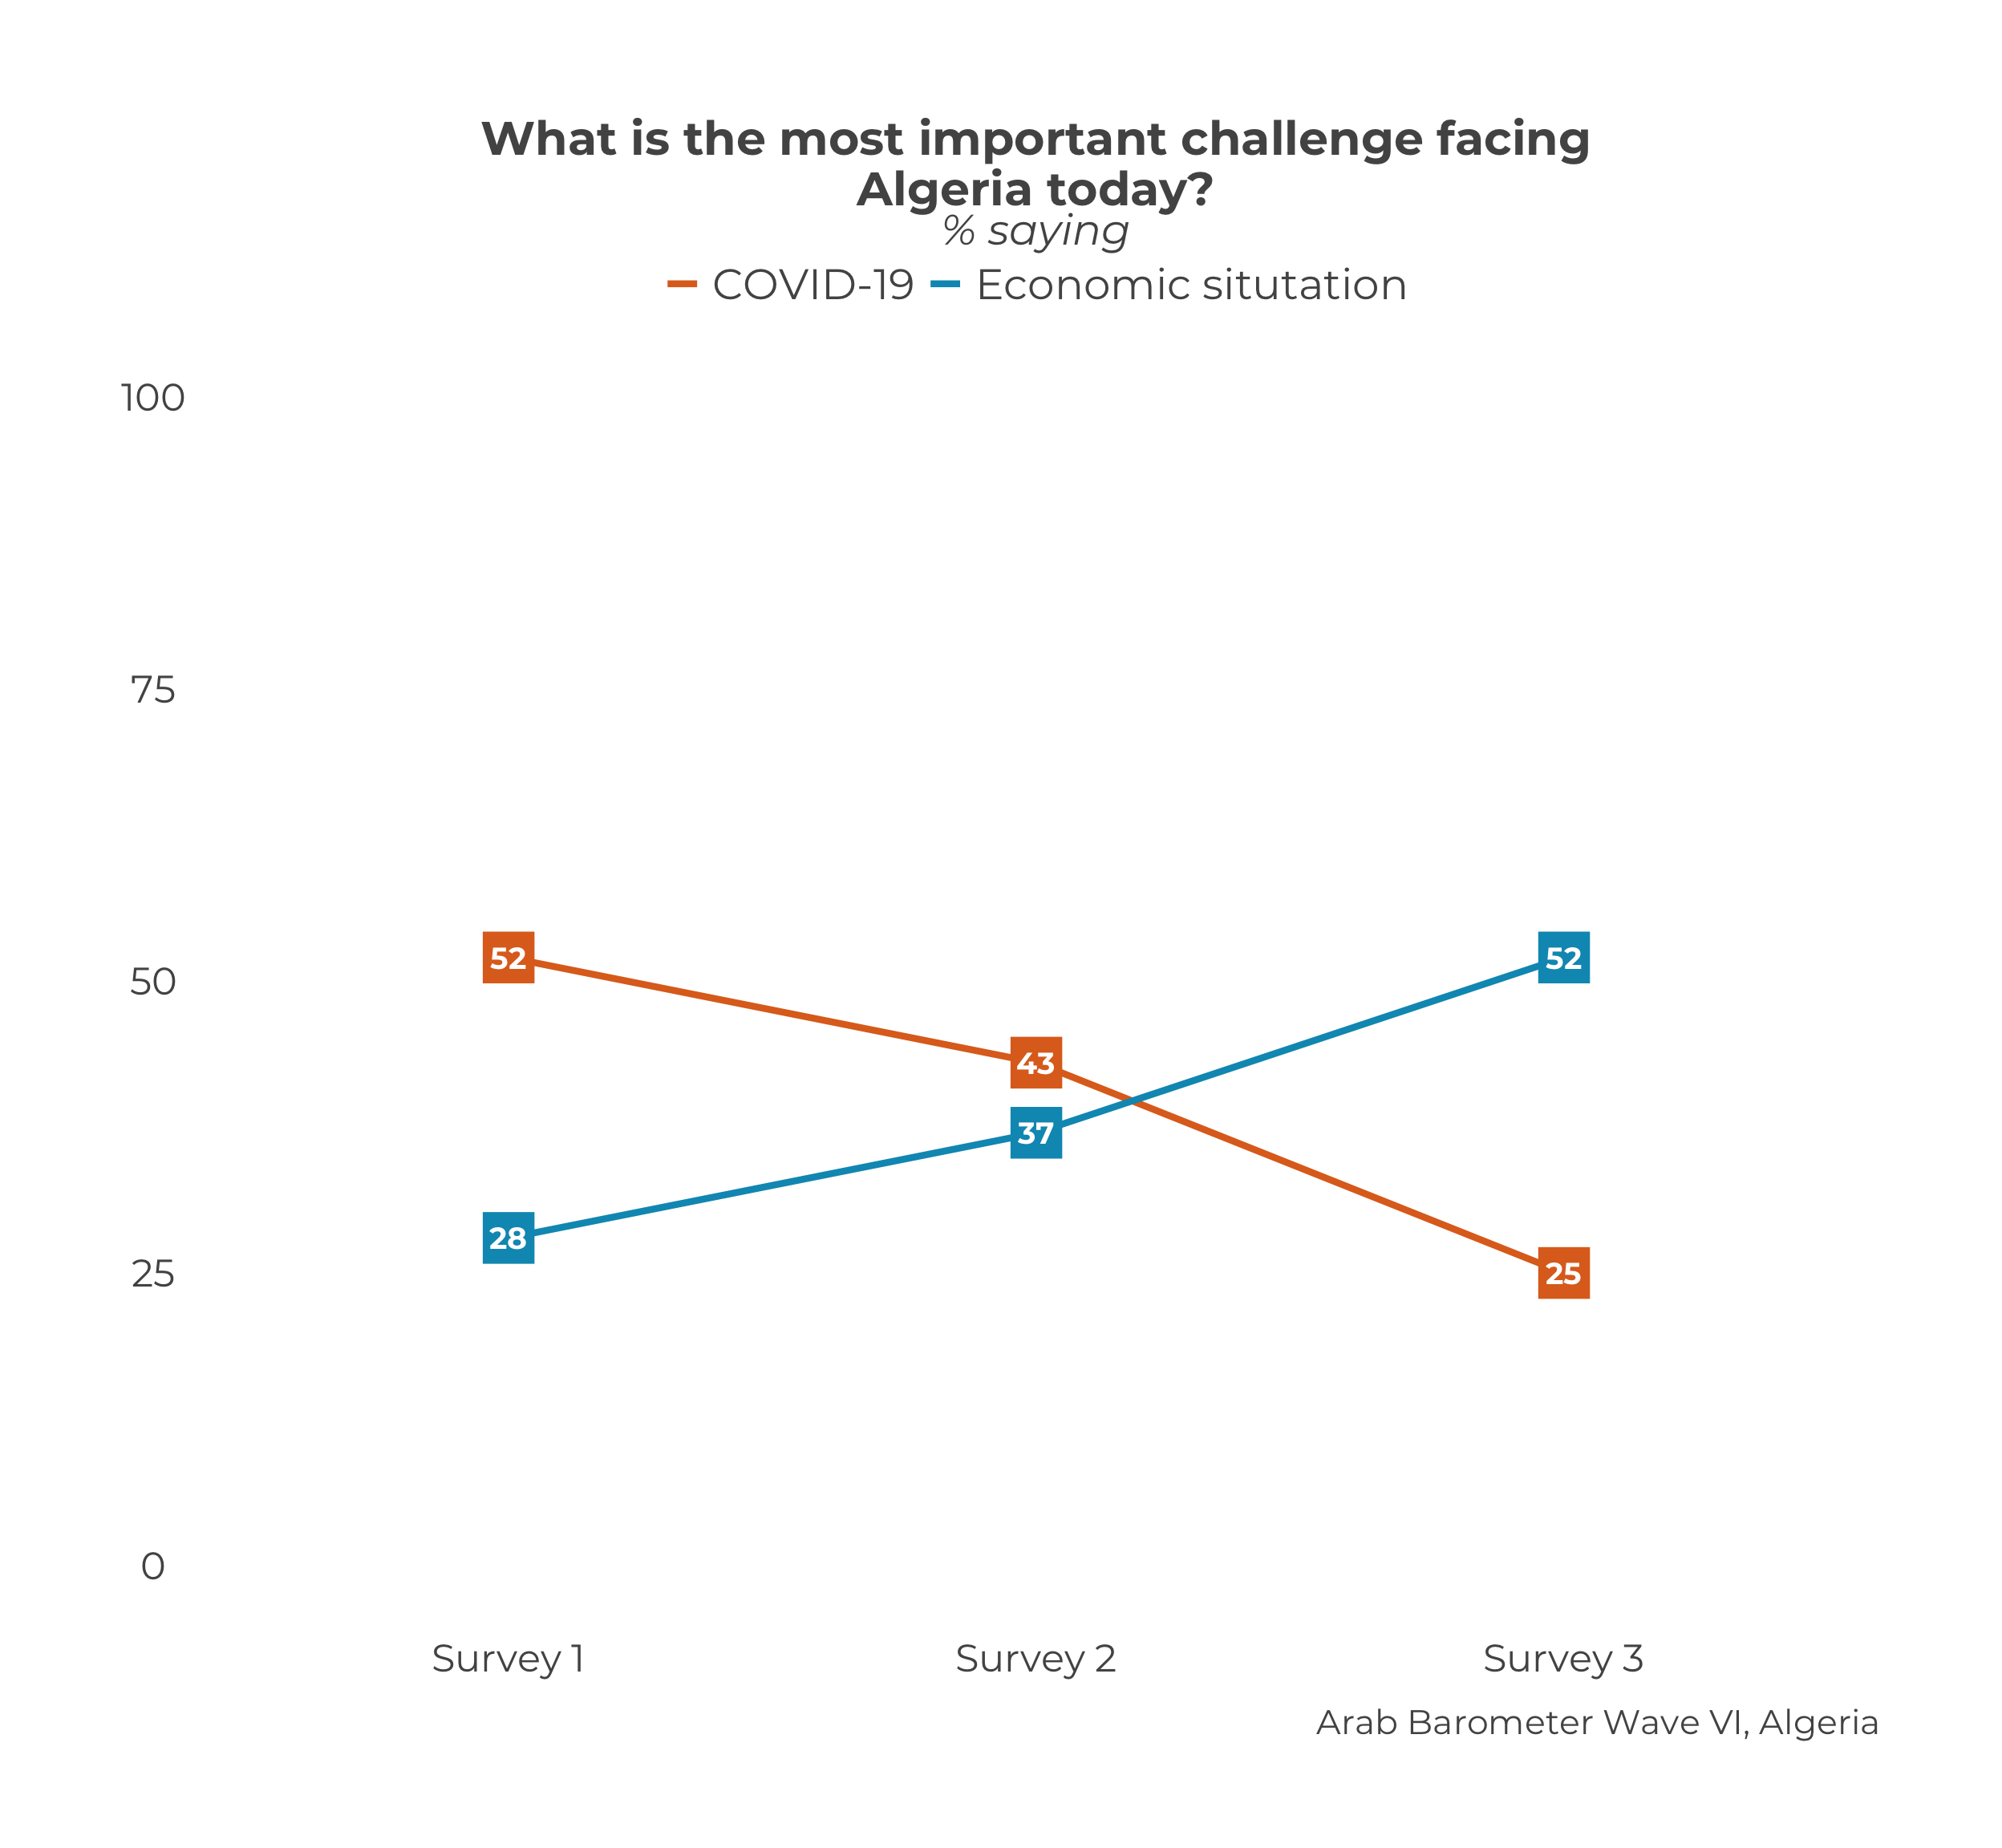
questions_2_compare <- list("Q2061A_1",
                            "Q2061A_15")

df_list <- list(survey1,
                survey2,
                survey3)

survey_dates <- c("Survey 1",
                  "Survey 2",
                  "Survey 3")

plot_trend_multiquestion_individual(questions_2_compare,
                                    df_list,
                                    survey_dates,
                                    "Algeria",
                                    legend.names = c("Economic situtation","COVID-19"),
                                    .title = "What is the most important challenge facing Algeria today?",
                                    .subtitle = "% saying",
                                    .caption = "Arab Barometer Wave VI, Algeria")
That code will produce the following graph:
Let’s go!